Narrative Monitoring

Stock Sentiment Monitoring

A sentiment score without context is just a number. When a stock's sentiment drops overnight, the question isn't whether it moved — it's whether financial news and social media are saying the same thing, what the narrative drivers are, and whether the shift looks like genuine signal or a single loud voice. Daily Brew gives you all of that, source by source, with explanations you can read in seconds.

Most sentiment tools produce a blended score and leave you to figure out the rest. Daily Brew's approach is source-aware and explainable by design. Sentiment is scored separately for news (RSS feeds) and social (Reddit channels) before being combined into a blended primary score — so when the two diverge, you see it immediately rather than having it averaged away. Every score is accompanied by a narrative driver summary and key insight fields so you can assess a ticker's sentiment picture in the time it takes to read a headline, not the time it takes to read every article behind it.

Day-over-day change is tracked across your full watchlist so momentum shifts are visible at a glance, and historical sentiment access means you can look back at how the narrative evolved — not just what it is today.

Live Sentiment Tracker

Today’s snapshot across all tracked names

The live tracker is designed for the first-thing-in-the-morning scan. Every tracked ticker appears in a sortable grid with blended sentiment score, separate RSS news and Reddit channel scores, day-over-day change, and short explanation and key-insight columns — so a desk covering dozens of names can triage in minutes rather than reading a full morning briefing for each one. Sort by change to find the names where narrative shifted overnight. Sort by blended score to see who's carrying the most positive or negative coverage momentum right now.

A chart layout complements the grid for teams that prefer to scan visually — momentum trends across your watchlist at a glance, with the same source-aware and explainable data underneath. Spot the names worth drilling into before the open, then move to the Sentiment Dashboard for the full per-symbol breakdown.

Daily Brew Live Sentiment Tracker – sortable grid showing blended sentiment scores, RSS and Reddit channel scores, day-over-day change, and key insight columns for tracked tickers

Live Sentiment Tracker grid — blended score, source breakdown, change, and explanation per ticker

Daily Brew Live Sentiment Tracker – chart view showing narrative momentum trends across tracked securities

Chart layout — scan narrative momentum visually across all tracked names

Problem

A sentiment score without context is just a number

Most sentiment tools produce a single blended number and stop there. The problem is that a blended score hides the things that actually matter for a trading or research decision: whether the negativity is coming from financial news or from Reddit retail activity, whether multiple models agree on the reading or whether one is an outlier, and whether this is a one-day narrative spike or a sustained shift in coverage tone.

When news sentiment is neutral and social sentiment is sharply negative — or vice versa — those are two completely different situations. A blended average that lands in the middle of both tells you almost nothing about which dynamic is actually at play.

How Daily Brew helps

Source-aware, explainable sentiment — not just a score

Daily Brew scores sentiment separately for news and social sources before blending, so divergences are visible rather than averaged away. Each report layers a multi-model breakdown with per-provider scores and confidence levels, then surfaces a narrative driver summary and key insight fields that describe what's actually behind the number — the key themes, the tone of coverage, the primary sources driving the move.

Day-over-day change is tracked across your full watchlist in the live tracker, and historical sentiment access lets you look back at how narrative evolved — not just what it is today. The signal can also be pushed downstream via API so the same explainable sentiment data flows into internal dashboards, alerting systems, or quantitative pipelines.

Why this use case stands out

Most sentiment tools tell you a stock's sentiment went negative. Daily Brew tells you whether that's financial news, retail social activity, or both — what the key narrative drivers are, how much the underlying models agree, and whether the shift looks like a one-day spike or a sustained turn. The difference between a score and a signal is the context around it.

Source-split
News and social scored separately
Multi-model
Per-provider scores with confidence
Explainable
Driver summaries, not just numbers

Sentiment Dashboard

Deep dive on a single symbol

When the live tracker flags a name worth investigating, the Sentiment Dashboard is where you go next. Search a ticker and get stacked sentiment reports — one per active feed — ordered chronologically so the narrative arc is easy to follow. Each report shows the full source context: which feeds are contributing, what the coverage tone is, and how the story has developed across the day or week.

The multi-model sentiment breakdown is the layer that separates explainable signal from a black-box score. Each report shows the blended primary score alongside per-provider scores and confidence levels — so you can see how much the underlying models agree on the reading, and what weight is being placed on which inputs. Below the score breakdown sits the narrative driver analysis: a short-form explanation of what's actually behind the sentiment, the dominant themes in current coverage, and the key points an analyst would want to scan before making a decision. The full article list behind each report is accessible for deeper digging when the summary raises questions worth pursuing.

Daily Brew Sentiment Dashboard – multi-feed sentiment reports for a single ticker with blended score, per-provider breakdown, and explanation

Sentiment Dashboard — stacked feed reports with blended score and per-provider breakdown

Daily Brew Sentiment Dashboard – key points, analysis summary, and confidence scores for a tracked security

Analysis and key points — readable driver summary with confidence scores per model

Capabilities

What teams can do in this workflow

Live sortable sentiment grid — blended score, source-level scores, day-over-day change, and explanation columns for every tracked ticker in one view; sort by any column to surface the names that matter most right now
Source-split scoring across news and social — RSS news feeds and Reddit channels are scored separately before blending, so divergences between financial editorial and retail social sentiment are visible rather than averaged away
Multi-model scoring with confidence levels — per-provider scores and confidence weights surface alongside the blended primary score, showing how much underlying model agreement sits behind the number
Narrative driver summaries and key insights — every sentiment report includes a short explanation of what's actually behind the score: dominant themes, tone of coverage, and key points to scan before deciding whether to act
Day-over-day change tracking and historical access — momentum shifts across your watchlist are visible at a glance; historical sentiment runs let you trace how narrative evolved over days or weeks, not just today's snapshot
API-ready for downstream integration — the full sentiment signal (scores, source breakdown, confidence, key insights) is accessible via authenticated API for integration into internal dashboards, alerting systems, or quantitative data pipelines

Workflow

How this plays out in practice

1

Open the live tracker for your full watchlist snapshot

The tracker loads today's blended sentiment, RSS and Reddit scores, and day-over-day change for every tracked ticker. Sort by change column to immediately surface the names where narrative shifted overnight — no reading required to get to the shortlist.

2

Check whether news and social sentiment are aligned or diverging

Source-split scores sit alongside the blended figure. When financial news and Reddit sentiment are moving in opposite directions — or one is moving and the other is flat — that divergence is visible immediately rather than hidden inside an average. The explanation column gives you the one-line reason without having to open the full dashboard.

3

Drill into a symbol for the full multi-model breakdown

The Sentiment Dashboard shows stacked feed reports with per-provider scores, confidence levels, narrative driver summaries, and key insight fields. Assess how much model agreement sits behind the blended score and what the dominant themes in current coverage are — then decide whether to act or monitor.

4

Push the signal downstream or monitor over time

Track day-over-day momentum in the live grid, access historical sentiment runs to trace how narrative evolved, or push the full explainable signal — scores, source breakdown, confidence, key insights — into internal dashboards or data pipelines via the sentiment API.

Business impact

What teams get from this workflow

Divergences between news and social are visible, not averaged away. Seeing news sentiment at neutral and Reddit sentiment sharply negative tells a completely different story than a blended score that lands in the middle — and Daily Brew shows you both numbers, not just the blend.
You know what's behind the score without reading every article. Narrative driver summaries and key insight fields distill the dominant themes and coverage tone into a form you can assess in seconds — so the explanation comes with the signal, not as a separate research task.
Model confidence is explicit, not hidden. Per-provider scores and confidence levels mean you can see when underlying models agree strongly on a reading versus when they diverge — a high-confidence blended score is more actionable than one where providers are split.
The same signal flows to wherever your team needs it. Whether that's a portfolio manager reading the live tracker each morning, an analyst drilling into the dashboard, or a quant team pulling data via API into an alerting system — the underlying explainable sentiment data is the same across all three access points.

Next step

See it on your actual watchlist

The fastest way to evaluate explainable sentiment is to see it on tickers you already know well — so you can judge the narrative driver summaries and source-split scores against your own read of those names.

In a 30-minute demo, we walk through the live tracker, sentiment dashboard, and API access on your tickers and sources. If your team is considering integrating sentiment data into a downstream system, bring that use case — we can show you exactly what the API returns and how other teams have mapped it into their pipelines.

See the sentiment workflow →

FAQ

Common questions about stock sentiment monitoring

What makes Daily Brew sentiment explainable?

Each sentiment report includes a short narrative driver summary and key insight fields that describe what's actually behind the score — the dominant themes in coverage, the tone of the articles, and the primary factors driving the positive, negative, or mixed reading. This means you can assess a ticker's sentiment picture in seconds without reading every underlying article. You get the signal and the explanation together, not a number you have to reverse-engineer separately.

How does Daily Brew separate news sentiment from social media sentiment?

Daily Brew scores sentiment separately for RSS news feeds and Reddit social channels, then combines them into a blended primary score. Both source-level scores are always visible alongside the blended figure, so you can immediately see when financial news and retail social sentiment are aligned — and when they're not. A stock where news is neutral and Reddit is strongly negative is a very different situation from one where both agree. That difference is surfaced explicitly rather than hidden inside an average.

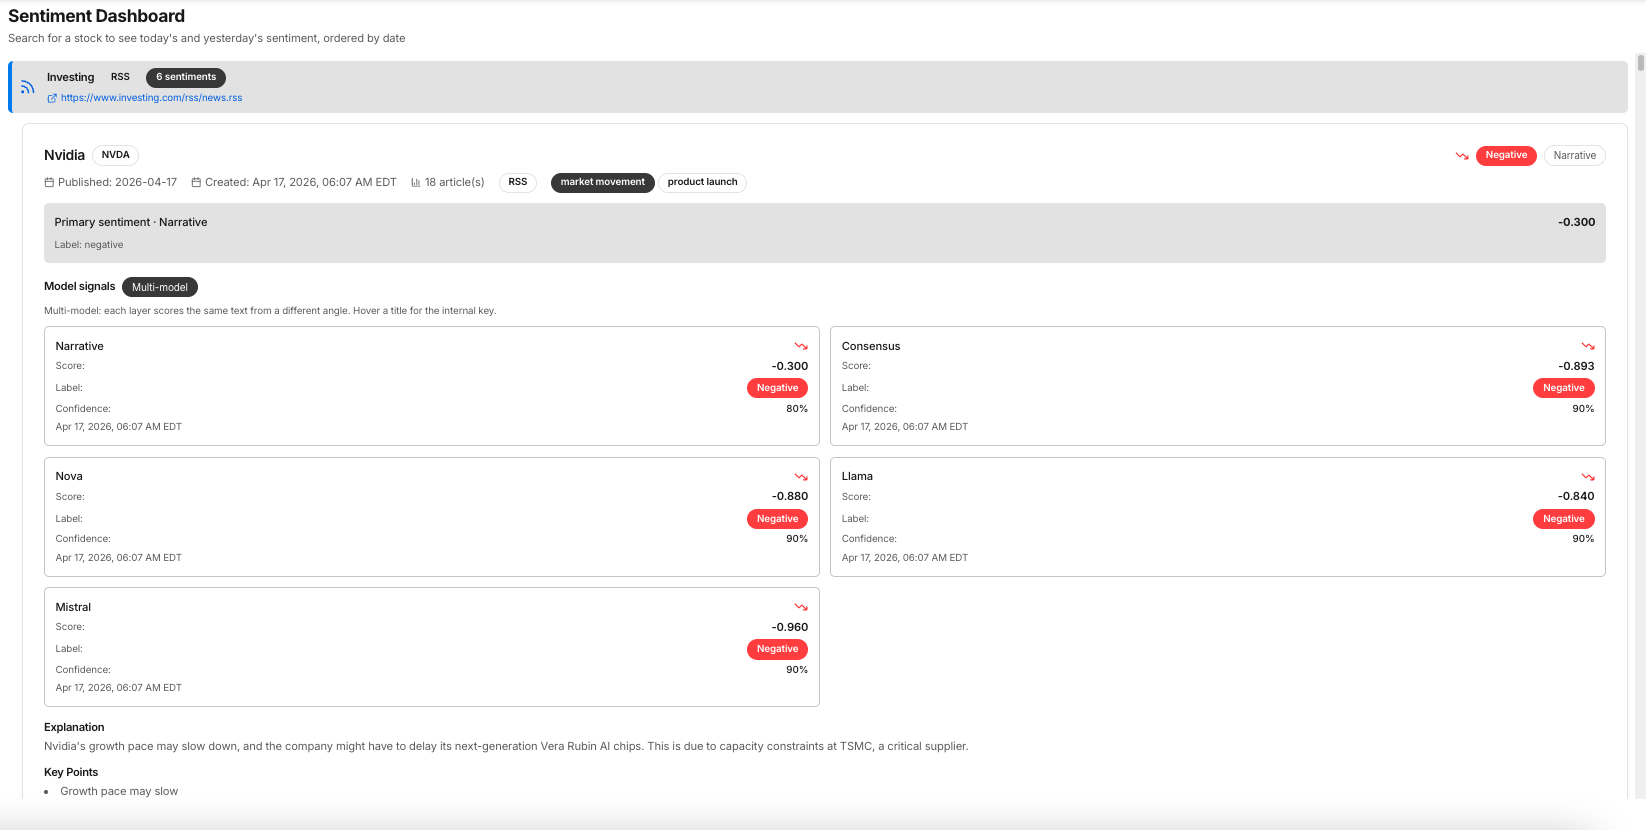
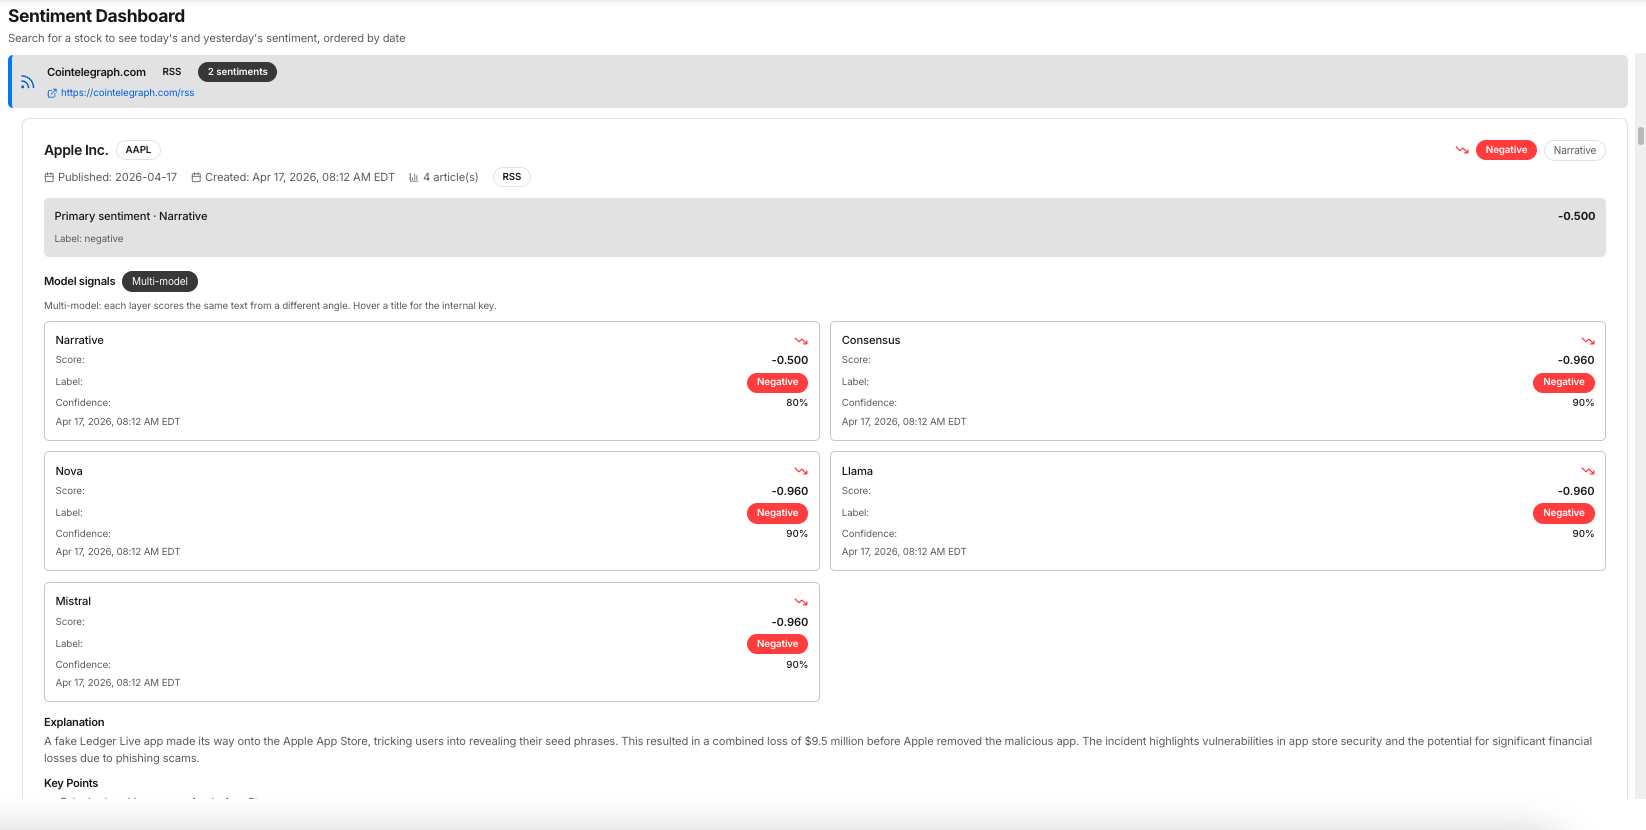
What is multi-model sentiment scoring and why does it matter?

Daily Brew runs each sentiment report through multiple underlying models and surfaces per-provider scores alongside their confidence levels, then blends them into a primary score. Seeing the per-provider breakdown tells you how much agreement sits behind the blended number. A blended score where all providers agree is more actionable than one where providers diverge — and that distinction is visible in the dashboard rather than hidden in a methodology footnote.

Can I see how sentiment has changed over time for a stock?

Yes. The live tracker includes a day-over-day change column for every tracked ticker — sort by this column to immediately surface the names where narrative shifted most overnight. Historical sentiment access lets you look back at past runs to trace how narrative evolved over days or weeks. The chart layout in the live tracker also makes it easy to scan momentum trends across your full watchlist visually before drilling into a specific name.

Can the sentiment data be pushed into our own systems?

Yes. Daily Brew exposes the full sentiment signal through an authenticated API — blended score, per-source breakdown, per-provider scores, confidence levels, and key insight fields — so downstream systems get the complete explainable data, not just a number. This makes it straightforward to integrate into internal dashboards, alerting systems, BI tools, or quantitative pipelines. See the Sentiment API use case for documentation and access details.

Is this designed for individual traders or larger research desks?

Both. Individual traders and analysts can use the live tracker and sentiment dashboard to monitor a personal watchlist with source-aware, explainable context each morning. Larger desks can push the same signal into shared dashboards and downstream systems via the API, so the entire team is working from the same underlying sentiment data — consistently scored, consistently explained, consistently accessible regardless of how many names the desk covers.

Ready to see it on your watchlist?

Book a 30-minute demo and bring your actual watchlist. We'll walk through the live tracker, sentiment dashboard, and API access on the tickers and sources your team tracks — so you can judge the source-split scores, narrative driver summaries, and multi-model breakdowns against names you already know.

Schedule a demo → View pricing